
Barcodes Don’t Lie – The Truth About Apparel Inventory Introduction
In apparel retail, memory is short and assumptions are dangerous. Many store owners still depend on staff feedback — “white shirts are moving fast,” “XL sizes aren’t selling,” or “this design is stuck.” While staff input is valuable, it’s rarely precise.
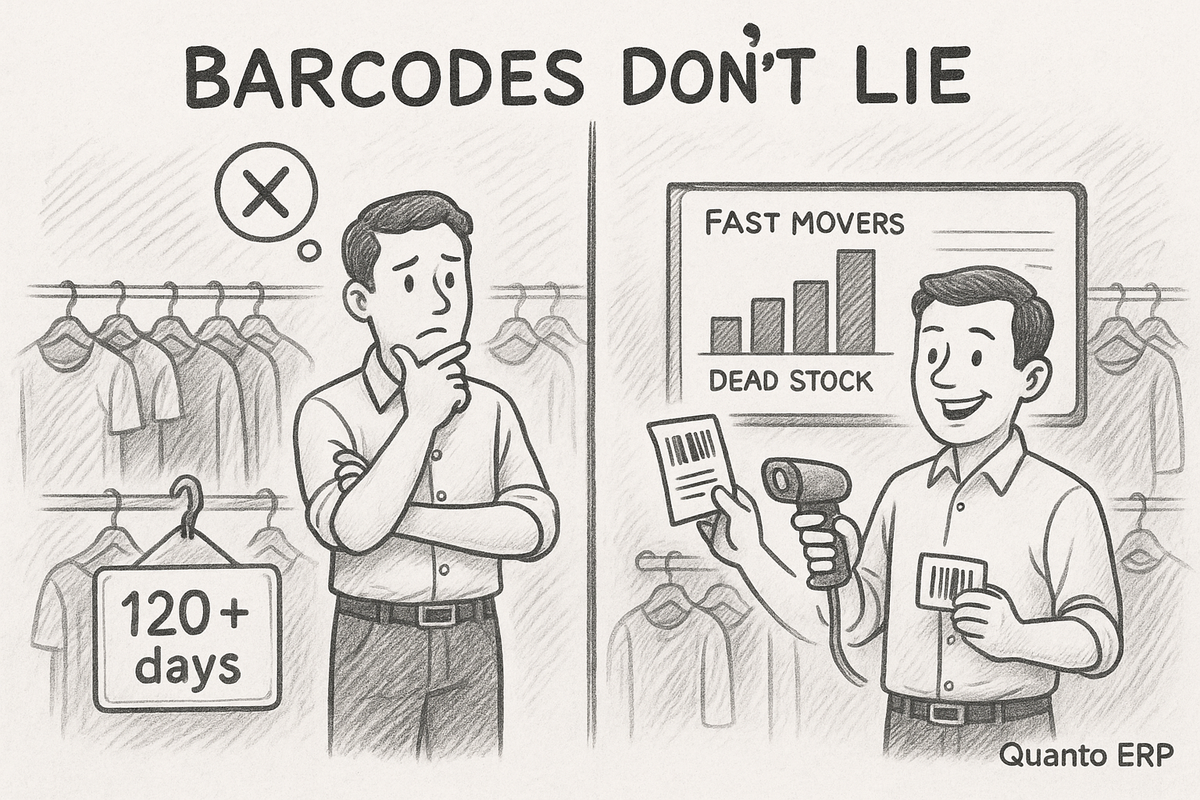
The only source of truth is your barcodes. Every barcode carries a story: when the product arrived, how fast it sold, how many are left, and how long they’ve been sitting unsold. When analyzed properly, barcodes reveal patterns that no guesswork can.
🕵️ Why Barcodes Matter More Than Opinions
- Stock Age Tracking
- Each scan shows the exact entry date.
- Items that cross 2× the average stock age can be flagged as dead stock.
- Demand by Size & Color
- Instead of “L sells better than M,” you get exact numbers.
- Example: 42% of sales were M size, but XL sold only 7%.
- Reorder Accuracy
- Barcodes show which combinations (color + size + fit) sold fastest.
- This ensures you reorder the right variants, not just the design overall.
- Return Analysis
- Track which barcodes come back most often.
- If a particular supplier or fabric has high return %, you know where the problem lies.
⚠️ What Happens Without Barcode Analysis
- Overstock: You reorder based on gut feel and end up with piles of slow-moving colors.
- Stockouts: Popular sizes vanish early while odd sizes remain. Customers walk away.
- Capital Lock: ₹10 lakhs in unsold stock, unnoticed for months because reports were vague.
- Supplier Blind Spots: Without barcode-based returns, you never identify which supplier gives problematic items.
📊 A Realistic Example
A retailer believed black shirts were “always the best-seller.” Staff kept repeating it. Barcode data, however, showed something different:
- Black shirts sold fast, yes — but only in M and L.
- In XL and XXL, they were stuck for 120 days.
- The retailer had locked ₹1.5 lakhs in unsold large-size stock.
After analyzing barcodes:
- The retailer reduced XL/XXL reorders by 40%.
- Shifted budget to popular fits in M/L.
- Within 2 months, sell-through rate improved by 18%.
✅ Turning Barcode Data Into Strategy
- Weekly Stock Age Report: Flag items aging beyond threshold.
- Size/Color Heatmaps: Visualize which combinations sell fastest.
- Supplier Scorecards: Identify vendors with consistent high-return products.
- Clearance Triggers: Automate promotions once items cross age limits.
🚀 Takeaway
Barcodes are silent witnesses. They don’t exaggerate, they don’t forget, and they don’t mislead. They show the raw truth about what’s selling and what’s stuck.
👉 Retailers who listen to barcodes make smarter buying, clearer promotions, and faster capital rotation.
👉 Retailers who ignore them keep repeating the same costly mistakes.
✨ End line: “Staff opinions are stories. Barcodes are facts. Build your retail strategy on facts.”