
The Science of Optimal Stock in Apparel Retail
Every apparel retailer faces the same daily struggle:
- Too much stock → capital blocked, heavy discounts, dead stock.
- Too little stock → empty shelves, frustrated customers, missed sales.
The solution isn’t buying more or less — it’s buying smartly. The real art of retail is finding the optimal stock: enough to meet demand, but not so much that it eats your margins.
But here’s the twist: in apparel, stock is multi-dimensional. Unlike FMCG where 1 kg of rice is 1 kg of rice, a single shirt has dozens of variations — size, fit, sleeve, color, brand, price point. A saree can differ by material, weaving city, color, and occasion.
This post explains a complete framework for finding optimal stock for apparel retail, combining formulas, attribute-level analysis, and Quanto ERP insights.
🔹 Step 1: The Foundation — Coverage & Stock Formula
The simplest way to define stock is:
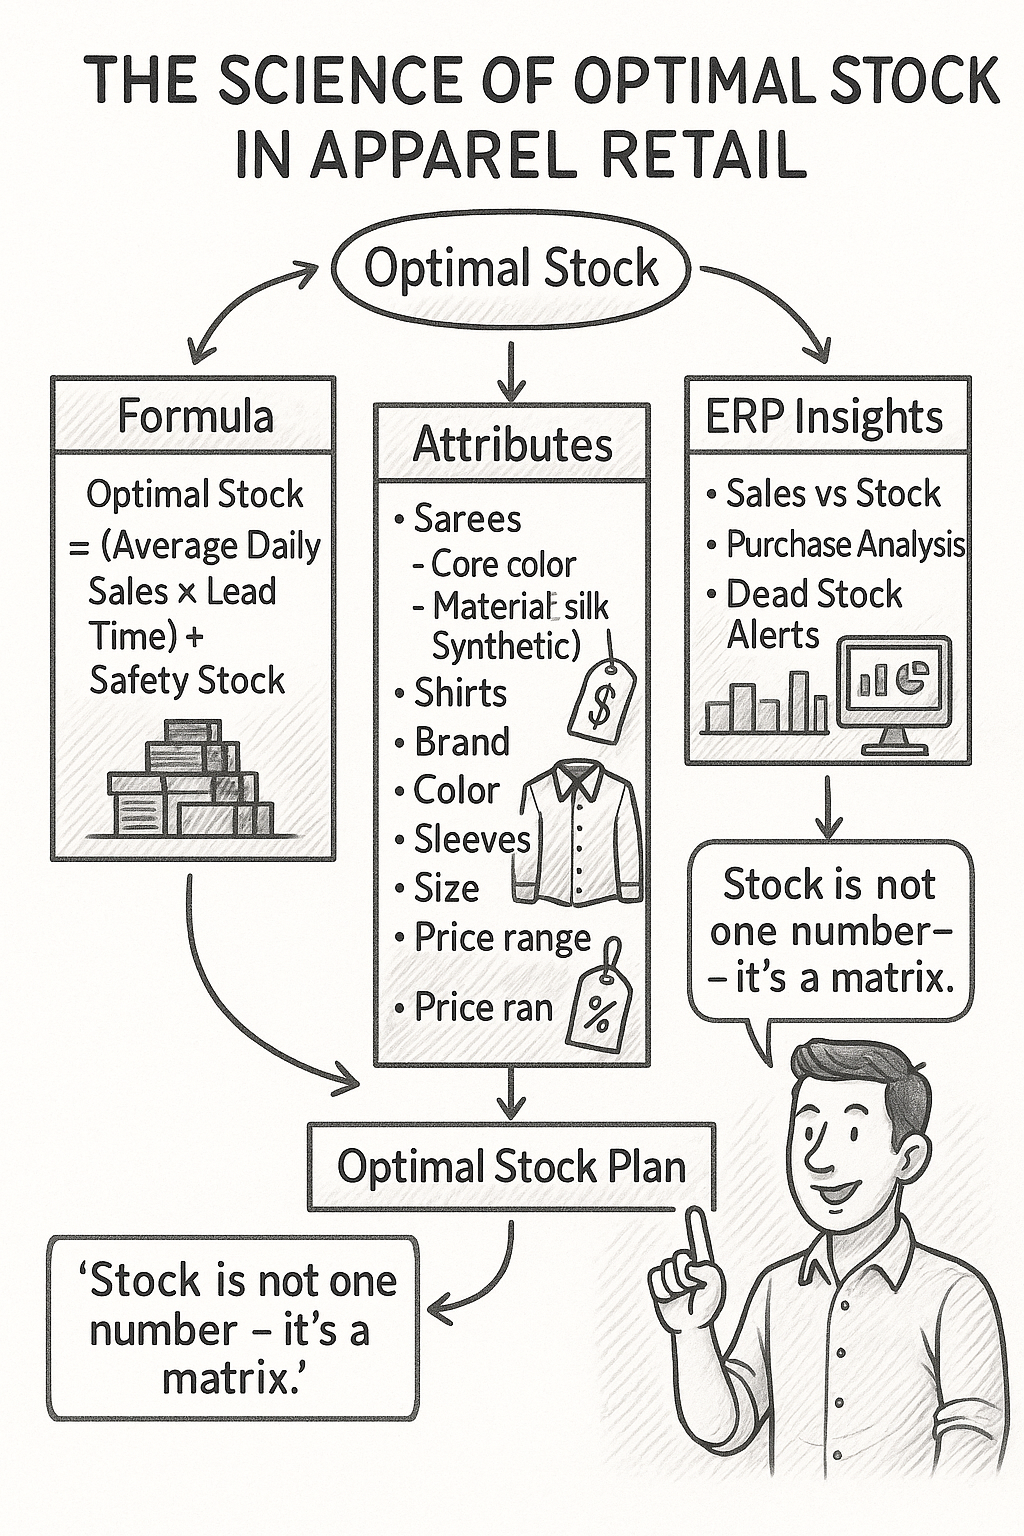
Optimal Stock = (Average Daily Sales × Supplier Lead Time) + Safety Stock
- Average Daily Sales = based on past 3–6 months of data.
- Lead Time = how many days suppliers take to deliver.
- Safety Stock = buffer (10–20%) to cover sudden spikes.
Example
- Avg sales: 50 pcs/day
- Lead time: 7 days
- Safety Stock: 100 pcs
👉 Optimal Stock = (50 × 7) + 100 = 450 pcs
If you’re holding 700 pcs, you’re overstocked. If you have 200, you risk stockouts.
This is the base calculation — but apparel is much more complex. Which brings us to attributes.
🔹 Step 2: Segmentation by Product Attributes
Sarees
A retailer can’t just say “we need 1,000 sarees.” That hides the complexity. Sarees should be split by:
- Color → Core colors (red, blue, black, cream) vs seasonal shades.
- Material → Cotton (daily wear), Silk (festive), Synthetic (budget), Designer (premium).
- Source City → Kanchipuram, Banaras, Surat, Kolkata.
- Price Range → Budget (<₹1,500), Mid (₹1,500–₹5,000), Premium (>₹5,000).
- Occasion → Daily, Festival, Wedding, Gifting.
👉 Example: Instead of 1,000 sarees, a retailer plans:
- 200 cotton sarees (₹1,000–₹1,500)
- 150 Kanchipuram silk (>₹5,000)
- 250 Surat synthetics (₹800–₹1,200)
- 100 Banaras (₹2,500–₹3,500)
This ensures the right mix, not just quantity.
Shirts
Shirts are equally multi-layered:
- Brand → Premium vs Local.
- Color → White, Blue, Black (evergreen) vs seasonal.
- Sleeve → Full vs Half.
- Size → XS, S, M, L, XL, XXL (M & L usually top movers).
- Fit → Slim, Regular, Comfort.
- Price Range → Budget (₹500–₹800), Mid (₹800–₹1,500), Premium (₹1,500+).
👉 Example: Instead of 500 shirts, stock plan looks like:
- 150 M/L slim-fit whites and blues.
- 100 half-sleeve trendy shades.
- 80 XL/XXL comfort-fit.
- 50 premium branded shirts.
Other Categories
- Trousers → Fit (slim, comfort), Fabric (cotton, denim), Occasion (casual, formal).
- Kidswear → Age group, Price sensitivity, Occasion.
- Festive Wear → Focus on seasonal spikes, past year sales patterns, trending designs.
🔹 Step 3: Attribute-Based Stock Matrix
Create a stock matrix combining attributes and sales data.
| Category | Attribute 1 | Attribute 2 | Attribute 3 | Price Range | Optimal Stock Plan |
|---|---|---|---|---|---|
| Sarees | Cotton | Red | Surat | ₹1,000–₹1,500 | 200 pcs |
| Sarees | Silk | Maroon | Kanchipuram | ₹5,000+ | 150 pcs |
| Shirts | M-size | White | Slim Fit | ₹1,000–₹1,500 | 120 pcs |
| Shirts | XL-size | Black | Comfort Fit | ₹800–₹1,200 | 60 pcs |
This gives a clear purchase guideline → ensuring stock variety matches customer demand.
🔹 Step 4: ERP Insights for Precision
Human intuition can’t track hundreds of attribute combinations — but Quanto ERP can.
- Sales vs Stock Report
- Simulates next week’s demand using last month’s sales vs current stock.
- Example: Last August, 500 cotton sarees sold in the first week. Current stock = 300. ERP auto-suggests 200 more.
- Purchase Analysis
- Highlights trending items at risk of stockout.
- Example: New kurta selling 30/day, stock 200 → only 6 days left. Suggests reorder now.
- Dead Stock Alerts
- Flags items aged 2× average stock life.
- Example: XL green shirts stuck for 120 days → stop reordering, bundle with fast movers.
🔹 Step 5: Avoid Common Stocking Mistakes
- Stocking Designs Without Size/Color Balance
- E.g., 100 shirts all in size XL → guaranteed dead stock.
- Ignoring Past Seasonal Data
- Overbuying “trendy” colors without checking last year’s sell-through.
- Not Considering Capital Cost
- ₹5 crore in stock means ₹40–45 lakhs lost yearly in interest. Optimal stock reduces this burden.
- Supplier Dependency
- Relying on one vendor/city limits variety and bargaining power.
📊 Real-World Example
A family-run retailer in Coimbatore used to stock 5,000 sarees without attribute planning.
- Result: Dead stock worth ₹20 lakhs after each season.
- Popular cotton sarees sold out early, premium silks were overstocked.
After shifting to an attribute-based optimal stock plan with Quanto ERP:
- Divided sarees into Cotton/Silk/Synthetic/Designer, then further by city & price.
- Sales vs Stock report guided mid-season reorders.
- Dead stock reduced by 35%.
- Sell-through improved from 65% → 82%.
🚀 Takeaway
Optimal stock isn’t about shelves being full. It’s about shelves being rightfully full — with the right sizes, colors, fabrics, and price points.
- Formula gives the base coverage.
- Attributes give the right mix.
- ERP insights make it real-time and data-driven.
👉 Retailers who master optimal stock:
- Free up capital.
- Reduce discounts.
- Improve sell-through.
- Win loyal customers who always find what they want.
✨ End line: “In apparel retail, stock is not one number — it’s a matrix. Master the matrix, and you master profitability.”